


The real question isn't "is AI worth it." It's what it costs and when it pays back
You have probably read both versions of the AI story by now. One says AI agents will transform your business. The other says they are overhyped and risky. Neither one helps you decide anything.
That is because "is AI worth it" is the wrong question. The right question is the one you already ask about a new hire, a delivery van, or a piece of equipment. What does it actually cost, all in? And when does it pay for itself? That is a spending question, and spending questions have answers you can check.
This report answers it in two halves. The first half is total cost of ownership. The subscription price on the vendor's website is a floor, not the bill, and we will walk through the four direct cost categories, plus the ramp effect that shapes all of them early on. The second half is a payback model you run on your own numbers. You put value on one side, cost on the other, and find the month they cross. That crossover is your payback date.
One thing to know up front: Praxivara sells an AI assistant, so treat this report as a framework you run yourself, not a pitch. Every worked example states its assumptions inline, and every hard number is tied to a named government or peer-reviewed source, so you can check our work.
The honesty contract. Nowhere in this report will you find a claim like "the average business saves X hours" or "typical ROI is Y%." We cannot know your business, and anyone who quotes you an average savings figure is selling, not reporting. The only numbers here are cited sources, published prices, and clearly labeled illustrative examples.
If you want the value side of the ledger, the descriptive numbers on admin time and cash flow, we published those separately in our small business automation report. This report owns the cost side and the math that connects the two.
What you actually pay: the sticker is a floor, not the bill
The plan fee is the easiest cost to see. It sits on a pricing page, it is the same every month, and you can compare it across vendors in five minutes. That visibility is exactly why buyers over-weight it. The plan fee may well be smaller than your internal time costs, particularly during setup and the early oversight period, and it is never the whole bill.
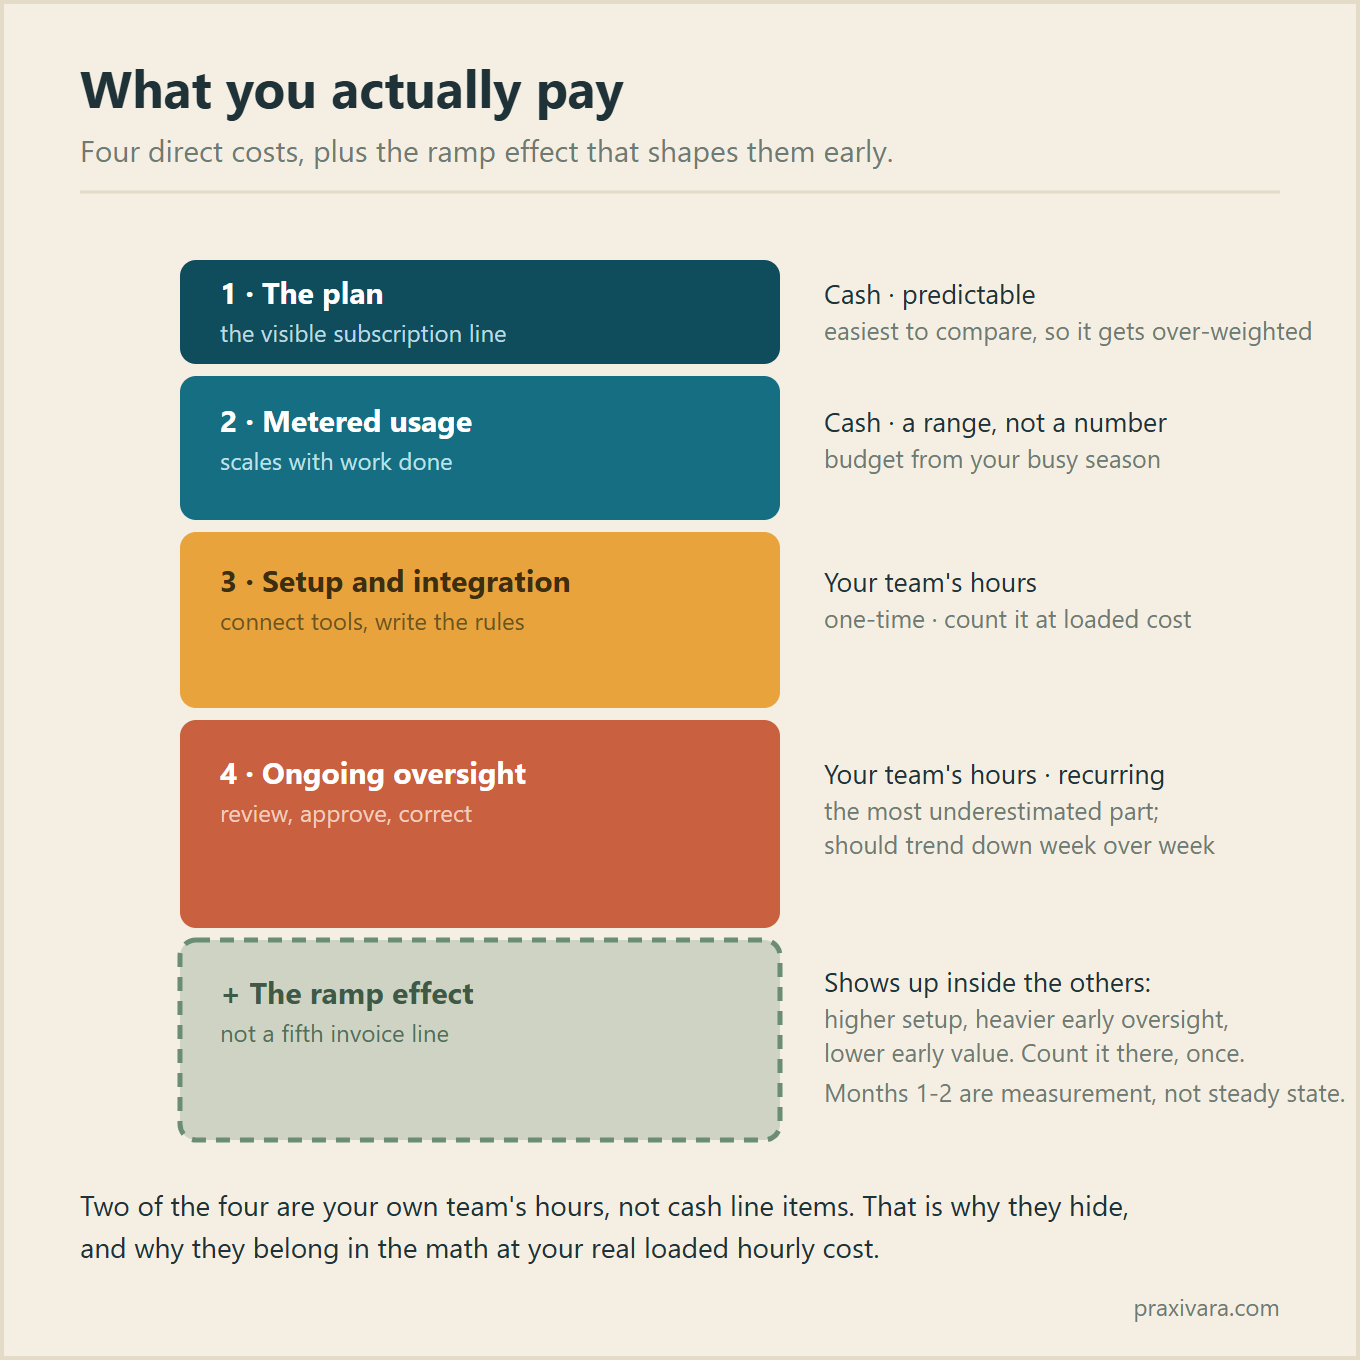
The full bill has four direct cost categories, plus one ramp effect:
- The plan. The recurring subscription. Predictable, visible, and only the floor.
- Metered usage. Cost that scales with the work done. More emails drafted and calls handled means a bigger number. This makes your bill a range, not a fixed figure.
- Setup and integration time. Connecting your inbox, calendar, and other tools, and writing the first instructions. Mostly your team's hours, paid once.
- Ongoing oversight time. Someone reviews drafts, approves sensitive actions, and corrects mistakes. Recurring hours, week after week.
- The ramp effect. Not a fifth invoice line, but the early stretch before the agent is trustworthy and fast. It shows up as higher setup hours, higher early oversight, and lower early value, so count it there, once, rather than as a separate charge.
Notice the trap. Two of the five, setup and oversight, never show up on an invoice. They are your own team's hours, so they hide. But hours have a cost like anything else, and a budget that skips them is not a budget. It is a guess that flatters the purchase.
The rest of this half walks through each part in order, including how to put an honest dollar figure on the time costs. Here is the whole stack in one picture.
Cost 1. The plan: the predictable floor, and where pricing models differ
You already know this number. It is the one on the pricing page, and it is the only cost part you can know before you sign up. The useful work is not staring at it. It is comparing the billing models behind it, because the model, not the sticker, decides how your cost grows as the work grows. You will run into four main shapes:
- Per-seat. You pay for each person who uses the tool. Cheap for a solo owner. It climbs fast when a five-person team all needs access, and it charges you for people, not for work done.
- Per-agent. You pay for each AI agent you run. This fits when one agent does one job. It gets expensive if the vendor pushes you to split one workflow across three agents.
- Per-conversation or per-resolution. Common in customer support. You pay for each ticket the agent handles or resolves. The unit price looks small. Multiply it by your monthly ticket count before you decide anything.
- Usage or credit based. You pay in proportion to the work performed, drawn from a credit allowance or metered directly. Your bill tracks your workload. It also means your bill is a range, which the next section covers.
Rule of thumb: do not compare sticker prices across different billing models. First translate each vendor's model into "what will this cost me in a busy month," then compare.
Also note who the unit is. Per-account pricing, where one price covers the whole account rather than each person, changes the math for teams. A $100 per-account plan and a $30 per-seat plan cross over at four people.
Watch for three traps in the fine print:
- Seat minimums. A "$19 per seat" plan with a five-seat minimum is a $95 plan.
- Annual-only lock-in. Do not commit to a year before you have proof the tool works on your tasks. A monthly option, or a real trial, is worth paying slightly more for at the start.
- Starter tiers missing the integrations you need. If the entry tier excludes your CRM or your phone system, the entry price is not your price. Price the tier you would actually use.
Whichever model you choose, write down what the plan fee buys and what it does not. Everything it does not cover shows up in the next four cost parts.
Cost 2. Metered usage: the part that scales with the work
Most AI agent products meter usage in some form, often as credits. Each task the agent does, an email drafted, a call handled, a document read, draws down the meter. When the allowance runs out, you buy more or you upgrade.
This is not a trick. It is closer to fair than flat pricing, because you pay in proportion to the work delivered. A month where the agent handles 400 tasks should cost more than a month where it handles 40. The subscription models we all grew up with hid this by charging everyone for the average.
But here is the honest part vendors gloss over: metered pricing means your bill is a range, not a number. A light month and a heavy month can differ several-fold. If you budget from a quiet month, your busy season will feel like a surprise. Budget from your busy season instead, and treat anything under that as savings.
The harder truth is that you cannot predict your usage before you have run real work through the tool for a few weeks. Any first-month estimate, yours or the vendor's, is a guess. Log what you actually burned, then set your budget from the data.
Because the bill can move, demand guardrails before you sign. Any serious vendor can provide these:
- Usage caps or alerts. You should be able to set a ceiling, or at least get a warning, before a heavy month becomes a surprise invoice.
- Per-task cost visibility. You should be able to see roughly what a given kind of task costs, so you can decide what is worth automating.
- Spike explanations. When usage jumps, you should be able to see what drove it. Which agent, which task, which day.
- No silent overage billing. Running out of credits should pause or prompt you, not quietly charge a premium rate.
If a vendor cannot show you why a bill moved, that opacity is itself a cost. You will pay for it in hours spent guessing and in budgets you cannot trust.
Cost 3. Setup and integration: mostly your team's hours
Setup rarely shows up as a cash line item, which is why almost nobody counts it. But it is real work: connecting the inbox, calendar, CRM, phone, and document storage; deciding what the agent may and may not do; writing the first instructions and playbooks; testing until the output is trustworthy.
Count it the only honest way: hours spent, times what an hour of your people costs, all in. That all-in figure is called loaded labor cost, meaning wages plus benefits, not bare wage. Per the Bureau of Labor Statistics Employer Costs for Employee Compensation release (March 2026), private-industry total compensation averaged $46.60 per hour worked, splitting into $32.60 in wages and $14.01 in benefits. That average leans on big employers, so for this report's audience the better anchor sits lower: the same release's establishment-size table puts total compensation at $37.36 per hour for establishments with 1-49 workers ($27.68 wages, $9.68 benefits). Treat $37.36 to $46.60 as the defensible range, use your own figure if you know it, and price an owner's time as opportunity cost rather than payroll, since owners are not paid in wages-plus-benefits form. The point is that setup hours are not free just because no invoice arrives.
How big is the number? It scales with how much you connect and how many custom rules you write:
- A single-inbox assistant, one connection, simple rules, is an afternoon.
- A multi-tool agent wired into billing, a CRM, and a phone line, with approval rules for anything touching money or customers, is days of work spread over a few weeks.
Neither is a reason to skip the project. An afternoon of setup against months of offloaded work is usually a good trade. But it belongs in the payback math, and it lands entirely in month one, which is part of why the payback curve starts underwater.
Method note: throughout this report, time costs are priced at that $46.60 loaded rate (BLS ECEC, March 2026) unless a scenario states a different one. Every worked example that uses it is labeled illustrative.
Cost 4. Ongoing oversight: the recurring cost people most underestimate
Someone has to watch the agent. In practice that means a person reviews drafts, approves anything that touches money or customers, and fixes the occasional mistake. This is the recurring cost buyers most often leave out of the math, because it never shows up on an invoice. It shows up on your calendar.
Here is the honest shape of it. Oversight never goes to zero, and you should not want it to. Actions that move money or go out to a customer deserve an approval step for as long as you run the tool. We cover how those approval gates should work in our AI agent security report. But while oversight never disappears, it must trend down. In the first weeks you check almost everything. As the agent proves itself, you stop reviewing routine work and check only the exceptions.
The diagnostic: if your oversight time is not falling after a few weeks, something is wrong. Either the task is a poor fit for an agent, or the setup needs rework. Do not wait it out. Flat oversight means the ROI math is in trouble, because you are paying for the tool and still paying for the labor.
Count oversight the same way you count any labor: hours per week times your loaded labor cost. Small numbers add up. Here is an illustrative example. Assume 20 minutes of review a day, five days a week. That is about 1.7 hours a week. At the $46.60 BLS loaded rate (March 2026), that is roughly $78 a week, or about $334 a month. That can rival the plan fee itself. It belongs in your model on day one, with a lower number penciled in for month three.
Method note: use your own loaded hourly cost if you know it. The BLS figures are averages, $46.60 across all private industry and $37.36 for establishments with 1-49 workers, not your number.
The ramp effect: the weeks before it's trustworthy and fast
The last cost is the learning period. For the first few weeks, the agent does not know your business. You are teaching it your rules, correcting its drafts, and building the habit of actually handing work off instead of doing it yourself out of reflex. All of that takes time, and during that stretch the agent is slower than the person it is helping.
The ramp is real, but it is temporary. It works on your costs in two ways. First, it front-loads hours: setup and oversight are both at their peak in the same weeks. Second, it depresses early value: the hours saved in week two are small, because you are still checking everything. Put those together and the picture is clear. Your payback curve starts below zero. It is supposed to.
That is why judging ROI in week one is a mistake. The first month or two is a measurement window, not a verdict. The question is not "did this pay for itself yet." The question is "is oversight falling, and is handed-off work staying handed off." If yes, the curve is bending the right way.
One bookkeeping rule keeps the ramp honest: it is an effect, not its own cost category. Its price is already inside the higher setup hours, the heavier early oversight, and the discounted early value. Charge it there, once. Giving the ramp its own line on top of those would count the same weeks twice.
Now the full picture is on the table. Four costs and one ramp effect: the plan, metered usage, setup hours, oversight hours, and the early stretch that inflates the last two while it discounts value. Once you can name them all, you can set them against value and find the month they cross. That is the second half of this report.
The hidden costs buyers miss
Beyond the parts above, there is a short list of costs that never appear on any invoice, and that even careful buyers skip. None of them is a reason not to buy. Every one of them is a reason to count honestly before you do.
| Hidden cost | Why it hides | How to count it |
|---|---|---|
| Your team's hours | Setup and oversight are time, not cash, so they never hit the books | Hours times loaded labor cost, every month |
| Switching and lock-in | Annual-only contracts and non-portable data only hurt when you try to leave | Ask about export and cancellation before you sign |
| Integration upgrades | The agent may need a paid tier of your CRM or phone system to connect at all | Price the whole stack, not just the agent |
| Failed experiments | A tool you try for two months and drop still costs you the fees plus every hour spent on it | Budget for one miss; pick tools with real trials |
| Tool sprawl | Overlapping subscriptions pile up one "cheap" tool at a time | Audit what the new tool replaces, then cancel it |
| Opacity | If a vendor cannot show what drove a usage spike, you cannot manage the bill | Treat missing per-task visibility as a cost |
| Rework during the ramp | Early mistakes take time to catch and redo | Fold it into your ramp-period hours |
| Integration fragility | A connection that breaks when your CRM changes costs you hours at the worst time | Prefer vendors who maintain the integrations themselves |
The pattern across all eight is the same one that runs through this whole report. The costs that hurt are the ones that hide, and the ones that hide are almost always measured in hours or in exit friction, not in the monthly fee. A buyer who counts them up front loses nothing if the tool works out. A buyer who skips them finds out the true total cost of ownership only after the money is spent.
Where the value actually comes from
Now the other side of the ledger. An AI agent pays you back in three ways, and only three. Anything a vendor promises should trace back to one of them.
1. Time saved
This is hours a person no longer spends on work the agent now handles. Inbox triage, scheduling, follow-up drafts, data entry. Be precise about what those hours are: time saved creates capacity, and its cash value depends on what happens to that capacity. It becomes real money when it cuts overtime or contractor hours, defers a hire, produces more billable output, or frees an owner for higher-value work. If the freed hours just make a salaried week calmer, report them honestly as an operational benefit, not as equivalent cash savings. When the capacity does convert, price the hours at a defensible rate: an employee's loaded labor cost (wages plus benefits, the $46.60 BLS average or the $37.36 small-establishment figure from the cost section), or, for an owner's own time, an opportunity-cost rate you can defend.
Is the time saving real, or just a demo trick? The best evidence says it is real, measured, and uneven. A peer-reviewed study in the Quarterly Journal of Economics (Brynjolfsson, Li and Raymond, 2025) followed 5,172 customer-support agents. Access to a generative-AI assistant raised issues resolved per hour by 15% on average. The largest gains went to newer, less-experienced workers. And a Federal Reserve analysis of the first nationally representative U.S. survey (Bick, Blandin and Deming, 2025) found that generative-AI users reported average time savings equal to about 5.4% of their work hours in the prior week, self-reported survey evidence rather than independently timed measurement.
Treat those two studies as proof the effect exists, not as your forecast. One measured support agents with a purpose-built tool. The other measured self-reported savings across all kinds of workers. Your result depends on your tasks and your people. Do not plug 15% into your spreadsheet and call it a plan.
2. Margin recovered
Some work does not just take time. When it slips, it costs sales. Missed calls, slow quote follow-ups, leads that go cold, invoices that go out late. When an agent catches that dropped work, the value is the contribution margin on the recovered sale, not the full invoice. Fulfilling a recovered job still costs labor, materials, and delivery, so a recovered $250 job at a 40% margin is $100 of value, not $250. Count margin, and the model stays honest for retail, trades, and agencies where delivery costs are real. For the broader picture of what admin drag and slow follow-up cost small businesses, see the stat sections of our automation report on admin time and cash flow. We keep those numbers there so this report does not restate them as its own findings.
3. Hiring avoided or deferred
Sometimes the agent adds capacity you would otherwise have hired for. If it lets you push a part-time admin hire out six months, the value is the loaded cost of that hire for six months. This is often the largest source of value and the easiest to state honestly, because the alternative had a price tag.
Count each economic benefit once. The three sources above overlap. If the saved hours are the reason you avoided a hire, count the hours or the avoided hire, not both. If freed hours are what someone spends recovering sales, count the recovered margin, and count the time separately only if it has an independent use. Double counting is how honest inputs still produce a dishonest total.
Which jobs tend to pay back cleanly is a separate question, and we answer it separately. See the green-light grid in our what-to-automate-first guide.
The payback model, in plain words
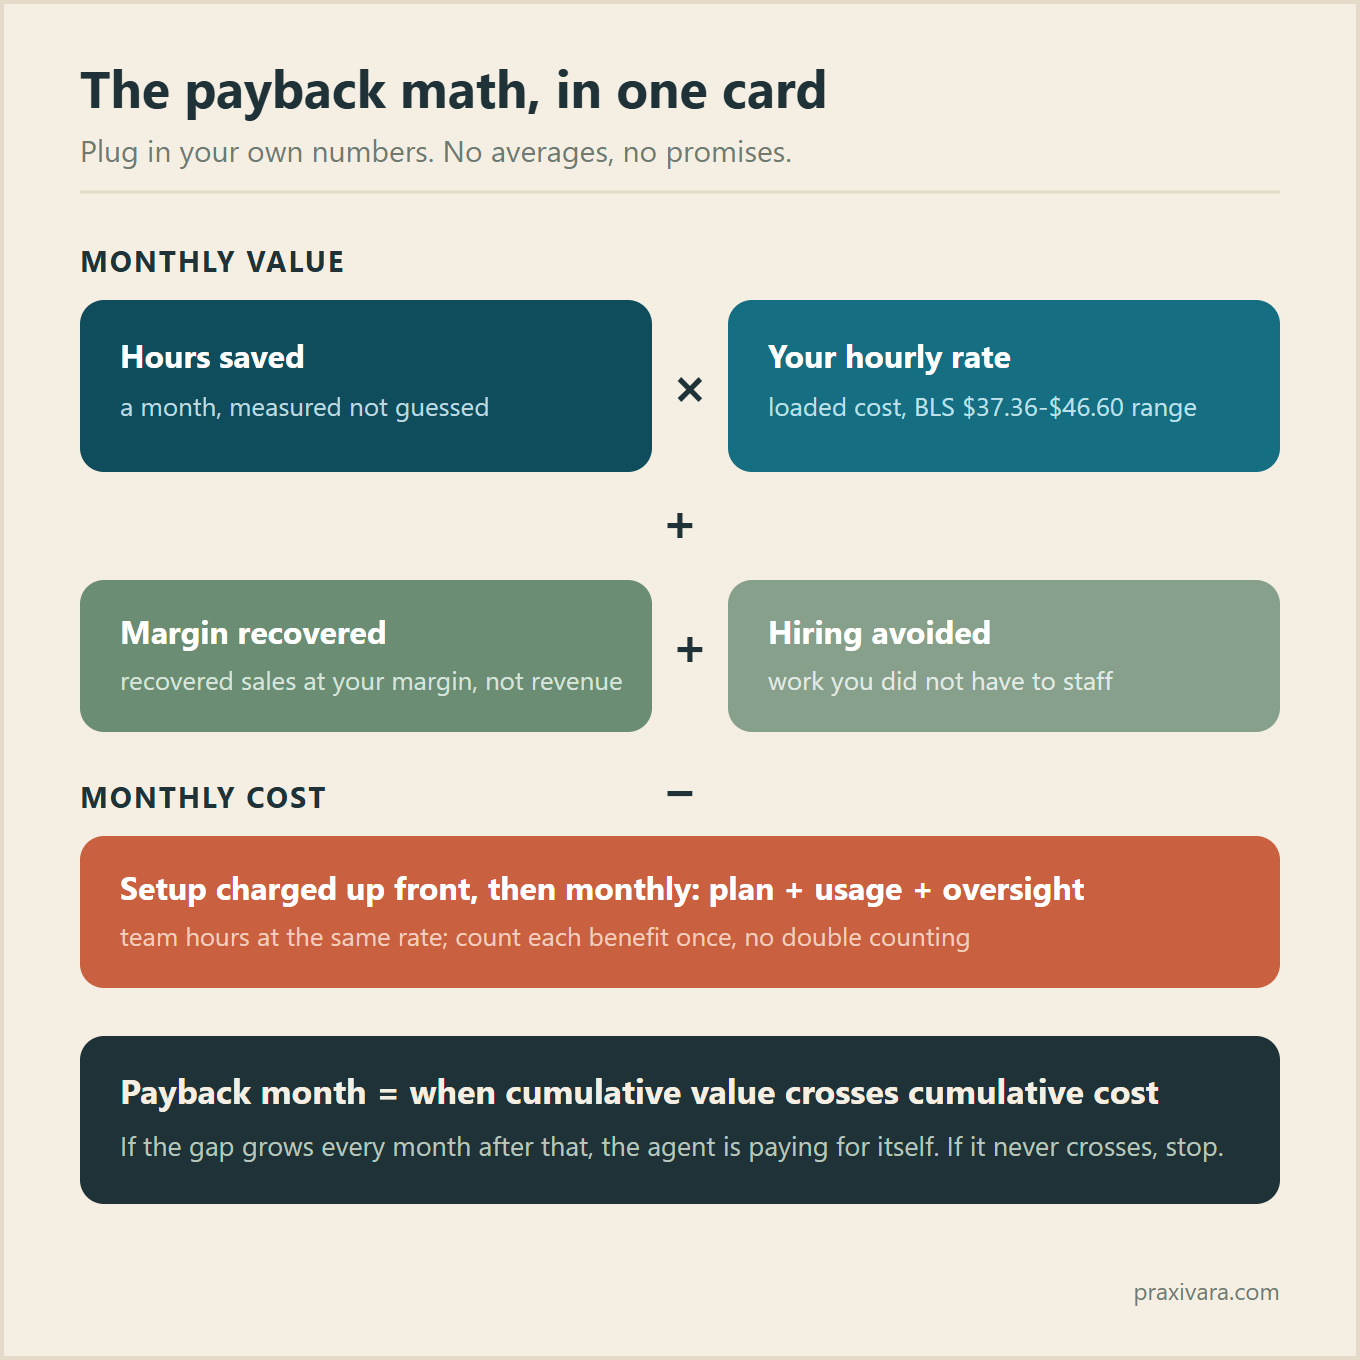
Here is the whole model in one paragraph. The agent costs you something up front, your setup hours priced at loaded cost, and something each month, the plan fee, metered usage, and your oversight hours at the same rate. Each month, it earns you something: hours saved priced at loaded cost, plus margin recovered, plus hiring genuinely avoided. Add each side up month over month. The month your running total of value crosses your running total of cost is your payback point. That crossover date, not the week-one impression, is the number that matters.
Spelled out as sentences:
- Initial cost is your setup hours multiplied by your loaded labor cost, charged in month one, not spread out. Spreading setup over future months is fine for budgeting, but it makes the crossover look earlier than it really is, so the payback math charges it up front, the way the worked scenarios below do.
- Recurring monthly cost is the plan fee, plus metered usage, plus weekly oversight hours multiplied by your loaded labor cost.
- Monthly value is hours saved multiplied by your rate, plus the incremental contribution margin recovered, plus the loaded cost of any hire you genuinely avoided or deferred.
- Payback is the first month where cumulative value is greater than cumulative cost.
As formula lines:
Initial cost = setup hours × loaded cost, charged up frontRecurring monthly cost = plan + usage + (oversight hours × loaded cost)Monthly value = (hours saved × your rate) + margin recovered + hiring avoidedPayback month = first month where cumulative value > initial cost + cumulative recurring cost
Run it yourself. Download the payback calculator (Excel). Fill in the yellow cells, your rate, plan, setup, oversight, and hours saved, and it computes the month-by-month table, flags benefit double counting, and returns your payback month. Setup is charged up front, exactly as in this report.
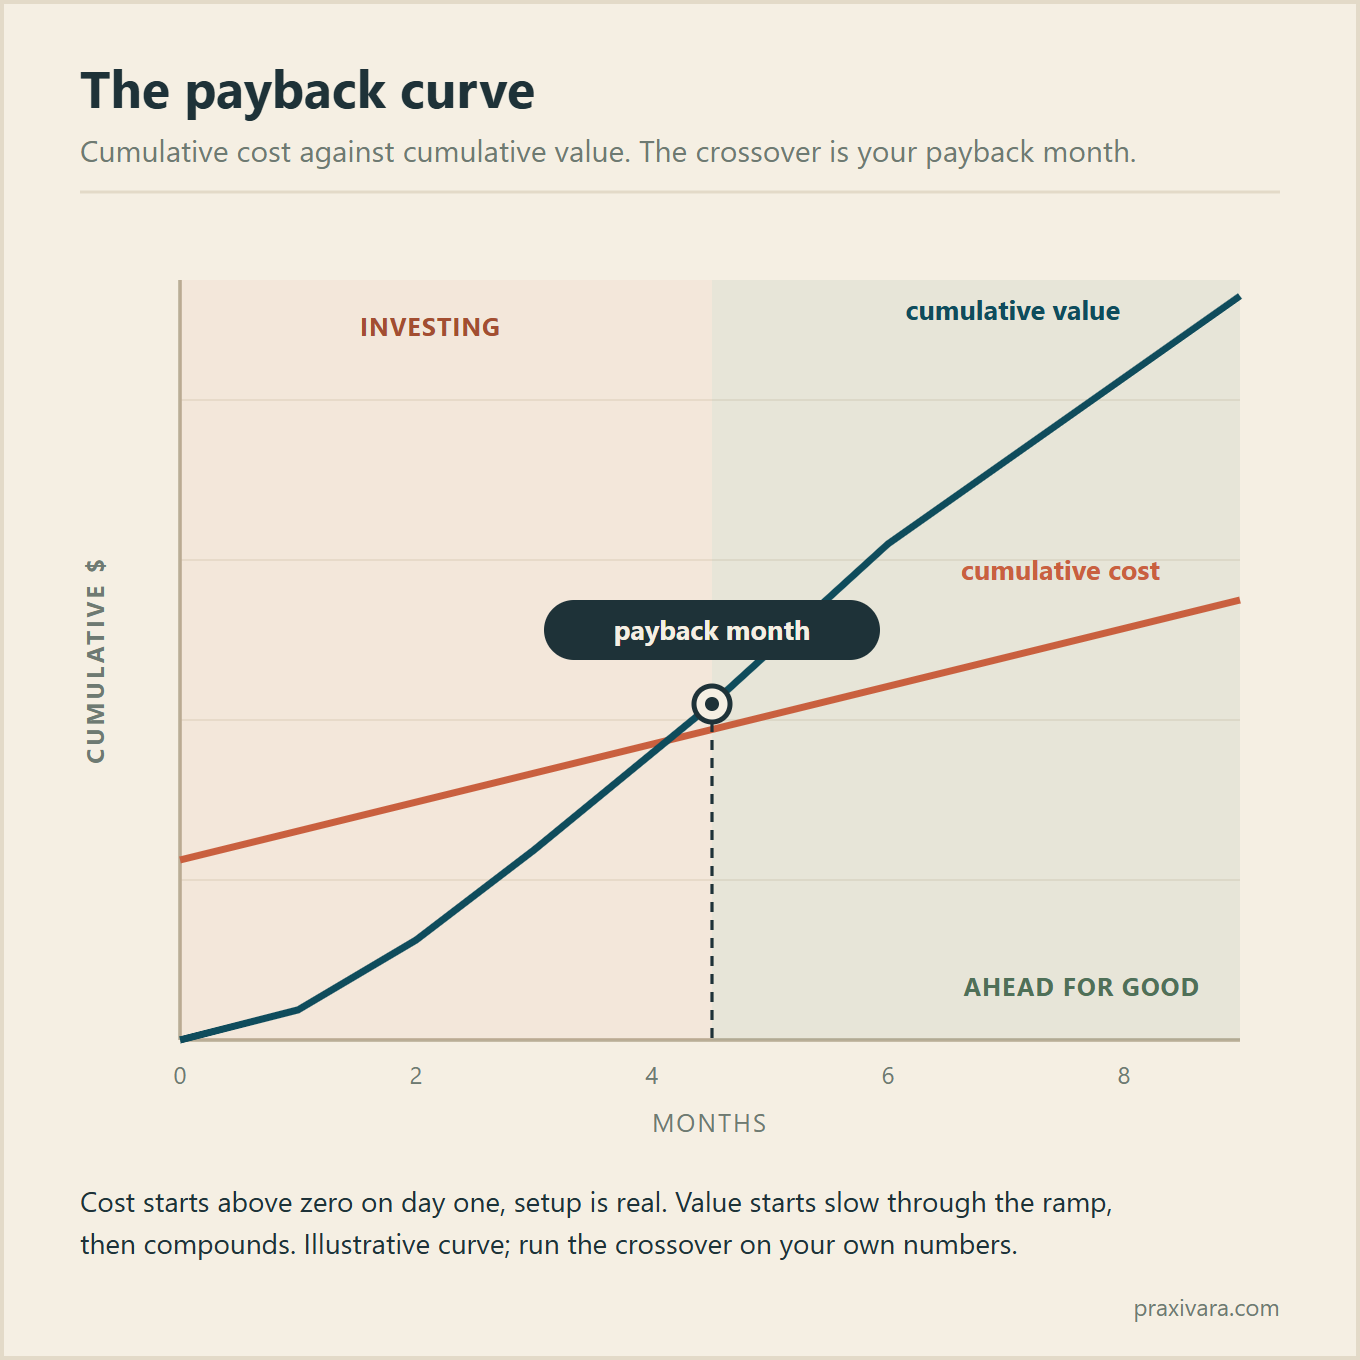
Your hourly rate is the single input that touches both sides of the model. Use your own figure whenever you have one; failing that, the BLS anchors from the cost section give a defensible range, $37.36 for small establishments up to the $46.60 national average. It also helps to read the result as two lines: cash ROI, the expenses actually avoided plus margin actually added, and capacity ROI, hours freed times your rate. Cash pays the bill; capacity is why next quarter looks different.
Expect the curve to start underwater. Setup hours and the ramp pile cost into the first weeks, while the agent is still slow and closely watched. Value builds later, as oversight falls and you hand off more work with confidence. That early dip is normal and temporary. The honest read is the slope: cost flattening, value bending upward, and a crossover you can point to on a calendar.
Two rules keep this model honest. First, every input is yours. Your hours, your loaded cost, your revenue numbers. Second, recompute the crossover once real usage replaces your first guess, because months one and two are data collection, not steady state. If the value line never bends up, or oversight never falls, the model is telling you something useful too. Stop, fix the task fit, or walk away cheaply.
Three worked scenarios (illustrative, assumptions stated)
The formula only means something with numbers in it. Here are three scenarios with every number stated up front. None of them describes a typical business, because there is no typical business. They show the shape of the math so you can run it on your own inputs.
Every figure below is an assumption we chose, not a measurement of any real customer. Where an input has a public anchor, we cite it. Everything else is labeled "assume." Change any assumption and the answer changes. That is the point.
Method note: all three scenarios use 4.3 weeks per month, cut month 1 value in half for the ramp, charge setup hours once in month 1, and price owner time at the $46.60 BLS loaded rate (March 2026). Role wages come from the BLS OEWS May 2025 medians cited inline.
Scenario A: solo owner offloading daily admin
Illustrative example, assume: the task is inbox triage, scheduling, and follow-up drafts. Hours saved, 5 per week at steady state, half that in month 1. Rate, $46.60 per hour, the BLS March 2026 loaded average, because the owner's time is the time being freed. Plan cost, $50 a month. Usage, assume it stays inside the plan allowance, $0 extra. Setup, 6 hours one time. Oversight, 2 hours a week in month 1, falling to 1 hour a week after.
Steady-state value is 5 hours x 4.3 weeks x $46.60, about $1,002 a month. If admin loads like this sound familiar, the descriptive numbers live in the automation report's admin-time section.
| Month | Cost | Value | Running total |
|---|---|---|---|
| 1 | $731 ($50 plan + $280 setup + $401 oversight) | $501 (ramp) | −$230 |
| 2 | $250 ($50 plan + $200 oversight) | $1,002 | +$522 |
Crossover: month 2. The assumption that most moves this result is the 5 hours. If the real number is 2, steady-state value drops to about $401 a month and payback slides out. Measure the hours. Do not guess them.
Scenario B: small team recovering missed inquiries
Illustrative example, assume: the task is answering missed calls and sending follow-ups that currently slip. Hours saved, 4 per week of a customer service rep's time at $21.53 per hour, the BLS OEWS May 2025 median wage for customer service representatives, wages only, no benefits, so this is conservative. Margin recovered, assume 4 previously missed jobs a month at $250 each with a 40% margin, $400 a month in margin, never the full $1,000 of revenue. Plan cost, $100 a month. Usage, assume $25 a month over the allowance in busy months. Setup, 10 hours one time at $46.60. Oversight, 2 hours a week of owner time at $46.60 for months 1 and 2, then 1 hour a week.
Steady-state value is $370 in labor plus $400 in recovered margin, about $770 a month. The cost of slow follow-up itself is covered in the automation report's cash-flow section.
| Month | Cost | Value | Running total |
|---|---|---|---|
| 1 | $992 ($100 plan + $25 usage + $466 setup + $401 oversight) | $385 (ramp) | −$607 |
| 2 | $526 | $770 | −$363 |
| 3 | $325 | $770 | +$82 |
Crossover: month 3. The assumption that most moves this result is the recovery rate. Four recovered jobs a month carries more than half the value. If the real number is one, payback pushes past month 6. Count your missed inquiries before you trust this math.
Scenario C: deferring a part-time hire
Illustrative example, assume: the task is the paperwork, data entry, and scheduling load that was about to justify a part-time admin hire. Hours, the assistant absorbs the equivalent of 10 hours a week at $22.81 per hour, the BLS OEWS May 2025 median wage for office and administrative support, wages only, so again conservative. Plan cost, $150 a month. Usage, assume $50 a month over the allowance. Setup, 12 hours one time at $46.60. Oversight, 3 hours a week of owner time at $46.60 in months 1 and 2, then 1.5 hours a week.
Steady-state value is 10 x 4.3 x $22.81, about $981 a month in avoided payroll.
| Month | Cost | Value | Running total |
|---|---|---|---|
| 1 | $1,360 ($150 plan + $50 usage + $559 setup + $601 oversight) | $490 (ramp) | −$870 |
| 2 | $801 | $981 | −$690 |
| 3 | $501 | $981 | −$210 |
| 4 | $501 | $981 | +$270 |
Crossover: month 4. The assumption that most moves this result is whether the offloaded work would truly have required the hire. If you would have muddled through without hiring anyway, the avoided payroll is not real value, and the case has to stand on time saved alone.
What moves your payback date
Payback is not one number. It is a range driven by a few assumptions, and knowing which one dominates your case is worth more than any point estimate. Four levers do most of the moving.
- Utilization. The single biggest lever. An agent you set up and stop handing work to saves nothing while the plan fee keeps running. Every idle week pushes the crossover out one for one. The value column only grows when work actually flows through the tool.
- Wage rate. Hours saved are priced at the loaded cost of the person freed up. Freeing 5 hours of a $46.60-an-hour owner is worth more than twice as much as freeing 5 hours at a $21.53 median rep wage. Same tool, same hours, very different payback date.
- Task repetitiveness. Repetitive, rules-shaped work offloads cleanly and ramps fast. Judgment-heavy work offloads slowly and keeps oversight high. The QJE support-agent study cited earlier fits this pattern: the largest gains went to newer workers handling routine support work, and gains varied by task. Pick tasks accordingly, and use the green-light grid to sort yours.
- Oversight overhead. Oversight hours sit on the cost side every month. If they fall as trust builds, the cost line flattens and the crossover pulls in. If they stay flat after a few weeks, the math stalls, and that is your signal to fix the setup or drop the task. Approval gates on money and customer actions keep oversight cheap without making it careless. The security report covers how.
How to measure YOUR ROI (a method, not a promise)
You do not need a consultant or a dashboard to know whether this is working. You need four weeks and a log. This is a method, not a guarantee. It can return a no, and a cheap, early no is a good outcome.
Week 1: baseline
Before you turn anything on, log a normal week. Track the hours spent on the tasks you plan to offload, and count the work that slipped: missed calls, late follow-ups, unsent invoices. Write the numbers down. This baseline is the only benchmark that matters. A national survey analyzed by Bick, Blandin and Deming for the Federal Reserve found generative-AI users reported average time savings equal to about 5.4% of their prior week's work hours. Your number may be far above or below that. The average tells you nothing about your business, which is exactly why you measure.
Week 2: instrument
Turn the tool on for one or two tasks and log everything. Setup hours, oversight hours, tasks handed off, tasks it completed without a fix. Expect this week to look bad. That is the ramp doing what ramps do.
Week 3: review the log
Read the log, do not skim it. Which handoffs stuck? Where did you redo the work? Is oversight time lower than week 2? Falling oversight is the leading indicator that the model is working. Flat oversight is the early warning that it is not.
Week 4: compute
Put week 4's real numbers into the formula. Hours saved times your loaded rate, plus any margin recovered, against plan, usage, and your logged oversight hours, with your setup hours charged in full against month one. The downloadable calculator does this arithmetic for you. Then project the crossover month and mark it on the calendar. When it arrives, check the log again against your own week 1 baseline, never against someone else's benchmark.
A real "what you actually pay" example, on published pricing
One vendor example, stated once, with the bias on the table. Praxivara is our product, so we can show you real published numbers instead of a vague range. Treat this the way you would treat any vendor's pricing page: as one input to the model, not the answer.
Praxivara has four plans: Plus at $49.99, Pro at $99.99, Premium at $149.99, and Elite at $199.99 per month. Billed annually, each runs about 10% less. There is a 7-day free trial, and you can cancel anytime. Every plan includes the full assistant. Higher tiers buy headroom, not a different product. The main headroom is credits, which range from 5,000 on Plus to 40,000 on Elite.
Credits are the usage meter. Each task draws credits in proportion to the real computing cost behind it, so a quick reply costs little and a long research job costs more. Routine work is routed to a capable but lower-cost model to keep the burn down. Billing is per account, not per seat, so adding teammates does not multiply the plan fee. For a small team, that changes the math.
The invoice still will not show you setup or oversight. Those hours are yours no matter which vendor you pick, and they go into the model at your loaded labor cost, same as everywhere else in this report.
Illustrative example, your numbers will differ. Assume the Pro plan at $99.99 per month, with usage staying inside the plan's credit allowance. Assume setup takes 8 hours in month one. Assume oversight is 10 hours in month one, 7 in month two, and 5 a month from month three on as trust builds. Assume the assistant saves 10 hours in month one, 15 in month two, and 20 per month after that. Value the hours at the $46.60 BLS loaded rate (March 2026), or use your own figure.
Month one costs about $939: the $99.99 plan, plus $373 of setup time, plus $466 of oversight time. Value is about $466. You are underwater, which is normal. Month two costs about $426 against $699 of value. By month three, cumulative value (about $2,097) crosses cumulative cost (about $1,698). On these assumptions, payback lands inside the third month. Change the hours-saved assumption and the crossover moves with it. That is the honest shape of the deal: modest cash outlay, real time investment up front, and a break-even date you can actually compute.
Frequently asked questions
How much do AI agents cost for a small business?
There is no single number, and anyone who gives you one is skipping most of the bill. The plan fee is only the floor. The full cost has four direct parts, the plan, metered usage, setup time, and ongoing oversight time, plus a ramp effect that inflates the early weeks. Two of the four are your own team's hours, so price them at your loaded labor cost, not zero.
What is a realistic payback period?
It is a range you compute, not a universal figure. The crossover depends on how cleanly the task offloads, how fast oversight falls, your usage volume, and what the freed-up hours are worth at your loaded labor cost. In the illustrative examples in this report, payback lands within a few months, but every one of those examples states its assumptions inline. Run the model on your numbers and treat the first two months as a measurement window.
Are AI agents worth it for a small business?
For the right task, the evidence says the gains are real but not uniform. A peer-reviewed study of 5,172 customer-support agents (Brynjolfsson, Li and Raymond, Quarterly Journal of Economics, 2025) found a generative-AI assistant raised issues resolved per hour by 15% on average, with the biggest gains for newer workers. A Federal Reserve analysis of the first nationally representative U.S. survey (Bick, Blandin and Deming, St. Louis Fed, 2025) found generative-AI users reported average time savings equal to about 5.4% of their work hours in the prior week. Neither number is your number. They tell you the effect is measured and real, and that it varies by task and worker. Whether it is worth it for you depends on picking work that offloads cleanly. Start with the green-light grid.
What are the hidden costs of an AI agent?
The big two are setup time and oversight time, because they never appear on an invoice. Behind those: lock-in cost if the contract is annual-only before you have proof it works, opacity cost if the vendor cannot show what drove a usage spike, rework during the ramp, and integration fragility when a connected tool changes. None of these are reasons not to buy. They are reasons to count honestly before you do, and to keep approval controls on anything that touches money or customers, covered in our AI agent security report.
Is usage-based pricing risky?
It makes your bill a range instead of a number, which is uncomfortable but fair: you pay in proportion to work done. The risk is manageable if you demand three things from any vendor: usage caps or alerts, per-task cost visibility, and a clear answer to why a bill moved. Budget from your busy season, not your quiet one, and treat your first month's usage as a guess to be replaced with real data.
Methodology and sources
This report is a synthesis and a framework, not a survey. We did not poll businesses, and we assert no averages of our own. Every hard number is one of three things: a figure from a named government or peer-reviewed source, cited inline with its date; a published price; or a clearly labeled illustrative example with every assumption stated. Productivity research is cited conservatively as evidence that gains are real and vary, never converted into a plug-in coefficient for your business. All sources were reviewed live in August 2026. One government item (a GAO report) was excluded because its URL did not verify at publication. Disclosure: Praxivara sells an AI assistant, which is why the single vendor example uses our published pricing and is labeled as such.
- U.S. Bureau of Labor Statistics, Employer Costs for Employee Compensation, March 2026: private-industry total compensation averaged $46.60 per hour worked ($32.60 wages, $14.01 benefits); the release's establishment-size table shows $37.36 for establishments with 1-49 workers ($27.68 wages, $9.68 benefits). Used to value time throughout.
- U.S. Bureau of Labor Statistics, Occupational Employment and Wage Statistics, May 2025: median hourly wages, office and administrative support $22.81, customer service representatives $21.53 (wages only). Used as role-wage inputs in worked scenarios.
- Brynjolfsson, Li and Raymond, "Generative AI at Work," Quarterly Journal of Economics, 2025. Peer-reviewed study of 5,172 customer-support agents; 15% average productivity gain, largest for newer workers.
- Bick, Blandin and Deming, Federal Reserve Bank of St. Louis analysis, 2025. Generative-AI users reported average time savings equal to about 5.4% of work hours in the prior week (self-reported survey evidence).
The honest bottom line
The sticker price is a floor. The real cost of an AI agent has four direct parts plus a ramp effect, and the two parts that hide, setup and oversight, are paid in your team's hours. The real return has three sources: time capacity valued at your rate, margin that stops falling through the cracks, and hires you genuinely defer. Payback is the month cumulative value crosses cumulative cost. That is arithmetic you can run today, and it is the only version of "ROI" worth trusting, because it is built from your numbers instead of someone else's average.
The buyers who come out ahead are not the ones who found a magic tool. They are the ones who counted the hidden time costs before signing, treated the first two months as measurement, and watched one leading indicator: oversight time falling week over week. When oversight falls and the crossover lands where the model said it would, the decision makes itself. When it does not, you find out early and cheaply, cancel, and lose little. Either way, you end up with an answer you can trust, because you knew what you were measuring.
No one can promise you a payback date. What a vendor can do is publish real prices, meter usage transparently, and make it easy to leave if the math does not work. What you can do is run the model before you buy. That transparency, not a savings figure, is the point of this report.
If you want to run the math on real numbers, start with published pricing and a free trial. See Praxivara's plans and pricing, pick the smallest plan that fits, and let your own baseline, not anyone's benchmark, tell you whether it pays.